Best practice tools
Work smarter and uncover deeper insights that build a clear, confident path to success at every stage, by using a wide range of best practice improvement tools
Empower teams
Drive meaningful change by providing teams with easy-to-use tools that remove complexity, boost confidence, and enable them to focus on what matters most
Save time
Bring all your tools together in one place, giving your teams a single, streamlined hub to plan, collaborate, and deliver results with greater clarity and speed
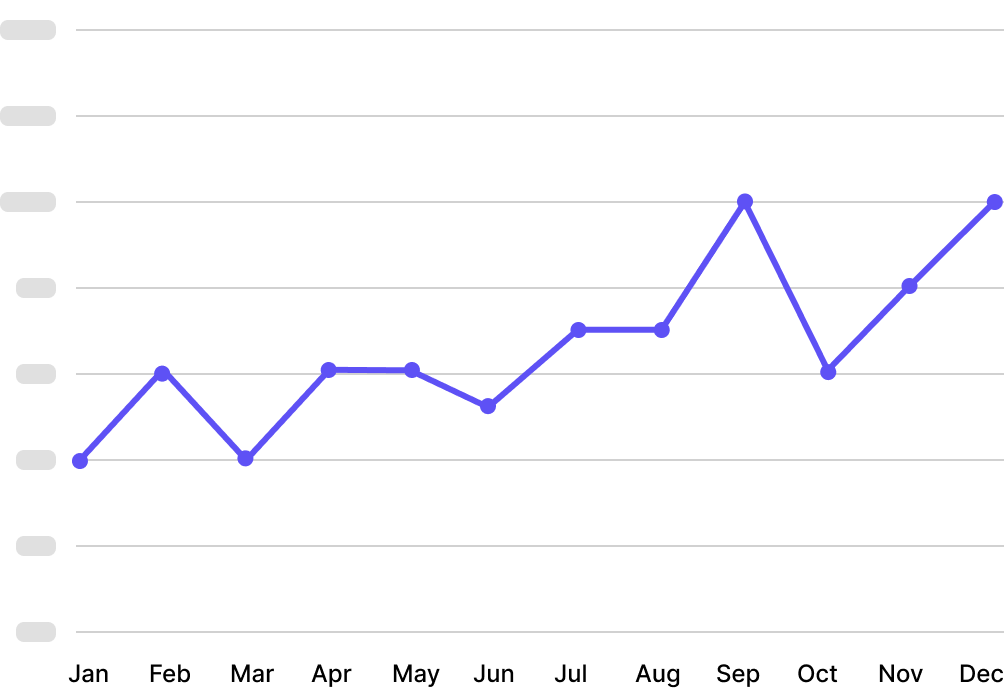
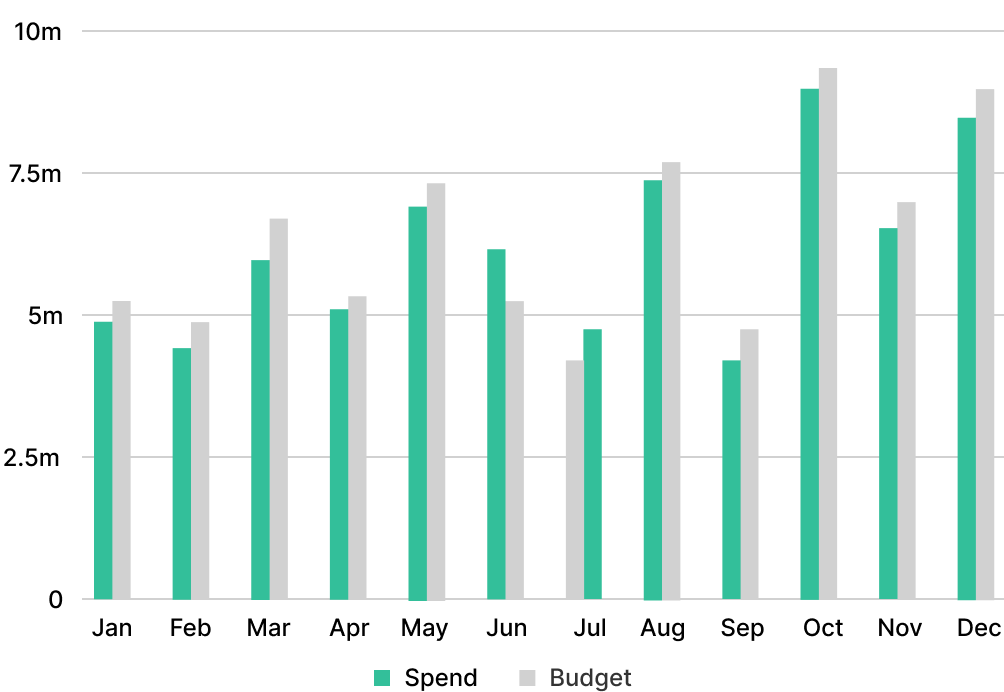
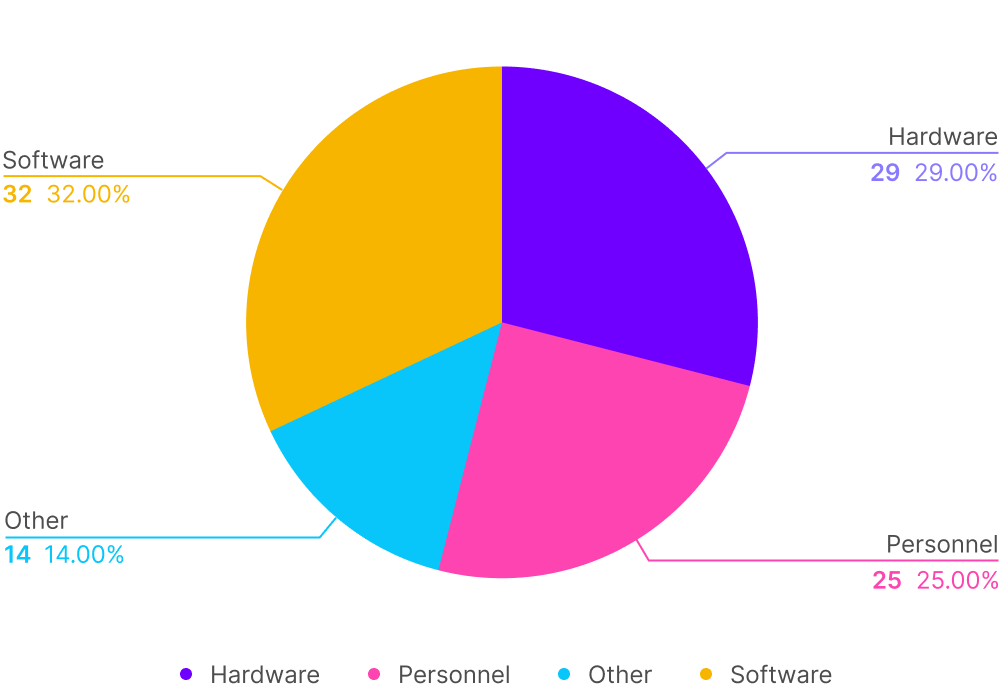
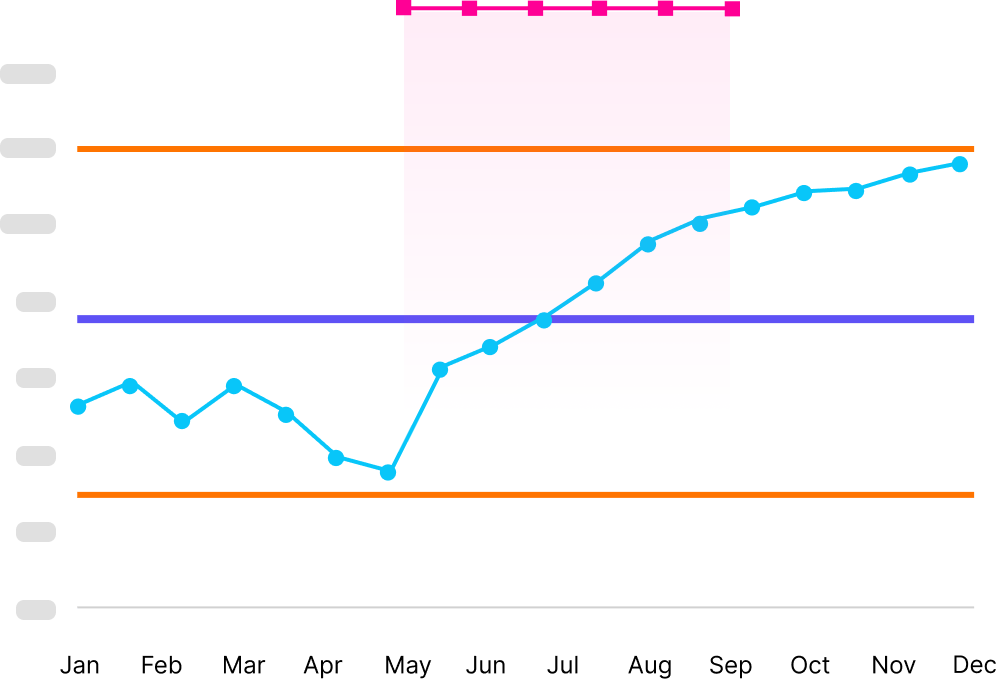
Charting
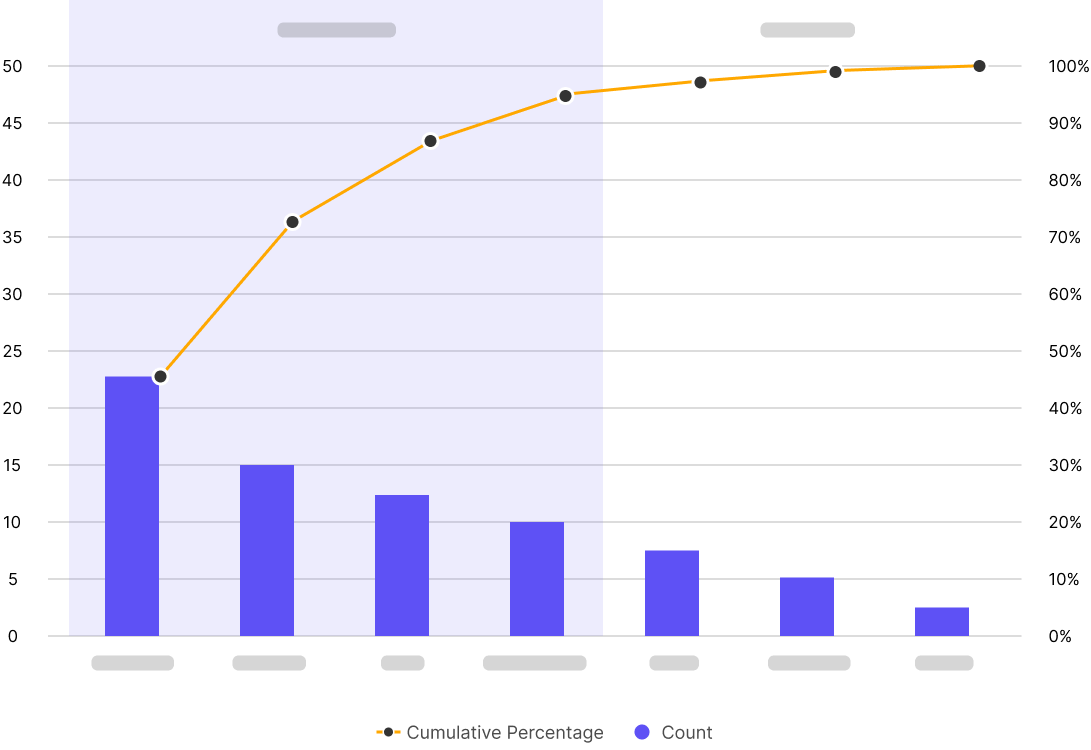
Measurement and data analysis are central to effective improvement so pick from a wide range of charts to visualise and analyse your data in the most effective way. From bar charts to control charts, Simana has it all.
Aggregation
Collect data from multiple sources and it will be automatically aggregated for you.
Statistical analysis
Simana analyses the variation in your data and alerts you to statistically significant changes.
Annotation
Display notes and events like PDSA cycles right on your charts.
Export
Export high res images and data dumps for ease of sharing.
Line charts
Bar charts
Pie charts
Run charts
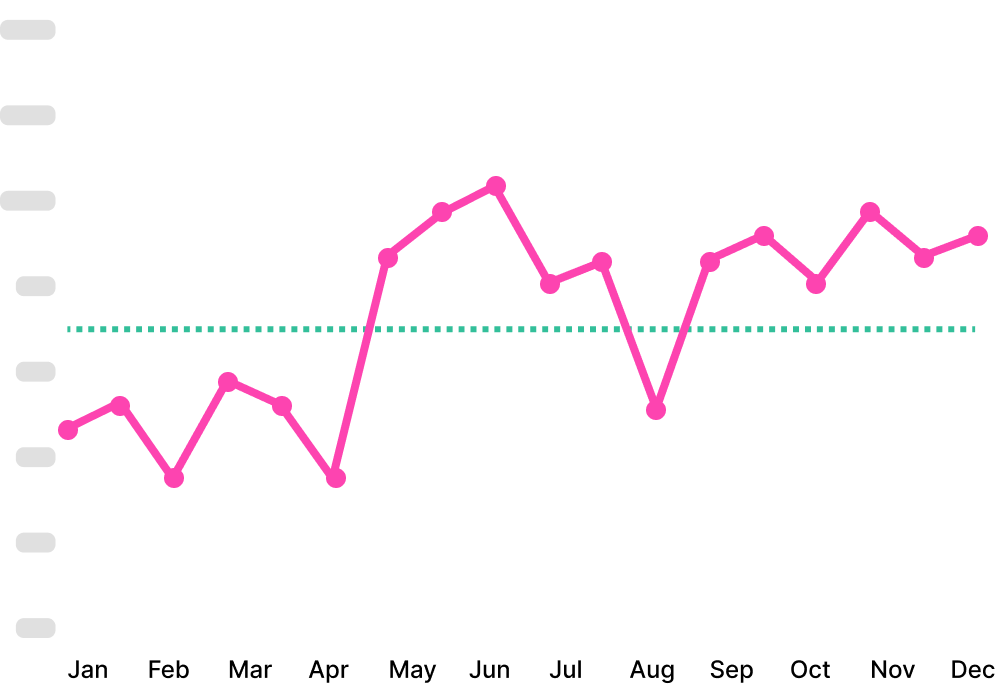
Control charts
Pareto charts

Process maps
Identify bottlenecks and streamline work by mapping out your workflows to create visuals which clearly communicate the 'as is' and 'to be' versions of your process
Analyse and understand
Map out every activity to create visual clarity.
Iterate easily
Create and modify process maps collaboratively.
More than a process map
Pull in any content you want - videos, photos, charts.
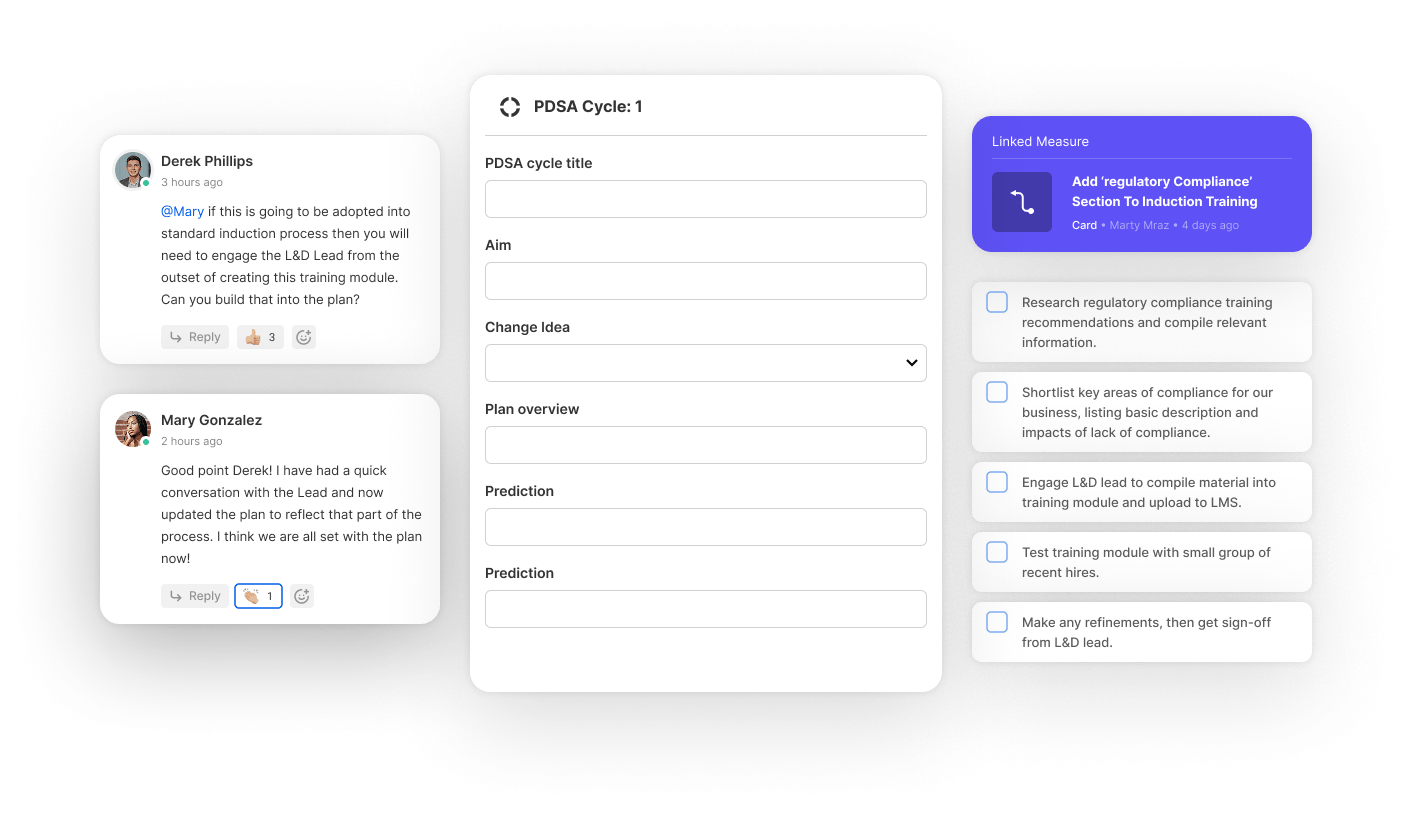
PDSA/PDCA cycles
Design, test and iterate changes, capturing the learning as you go. The simple but powerful tool for testing and building on incremental changes.
Create and assign tasks
Add tasks to set-up your test of change, assign the relevant people and include deadlines.
Measure impact
Link PDSA cycles to your data to analyse the impact of your changes.
Adopt, adapt or abandon
Easily capture the outcome of your test and progress to the logical next step.
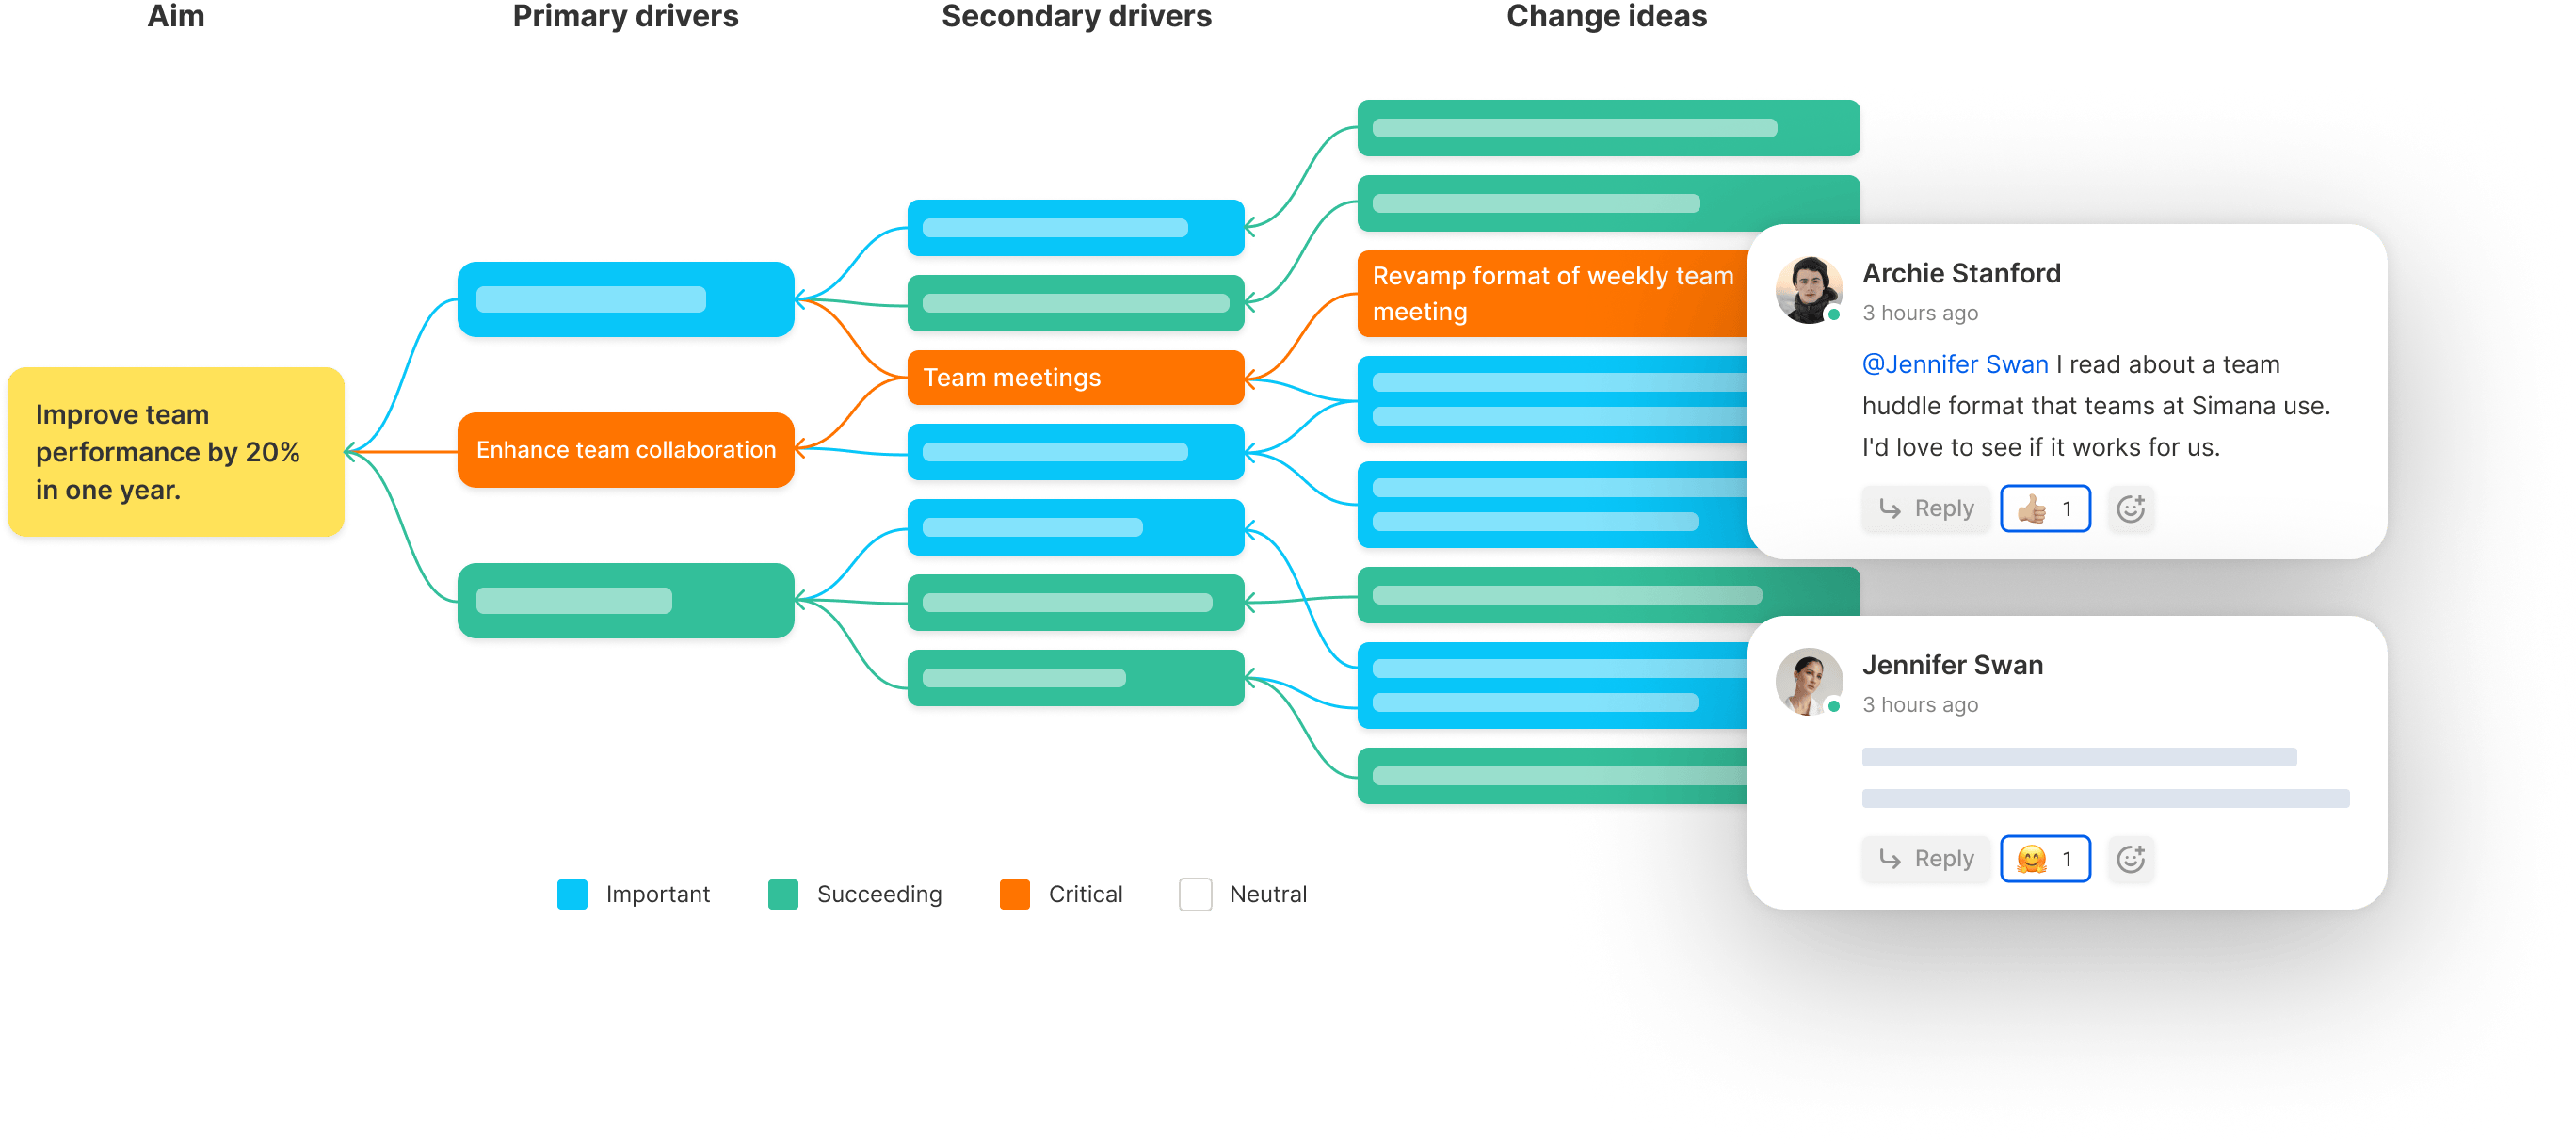
Driver diagram
Visually display the key factors affecting your goal and the changes you want to test in pursuit of improvement.
From aim to change
Capture the full spectrum from overall aim, through drivers affecting the aim, to ideas for change.
Link related work
Link each driver to its related data, tasks, or projects.
Colour code
Use colours to communicate information such as importance, progress or location of work.
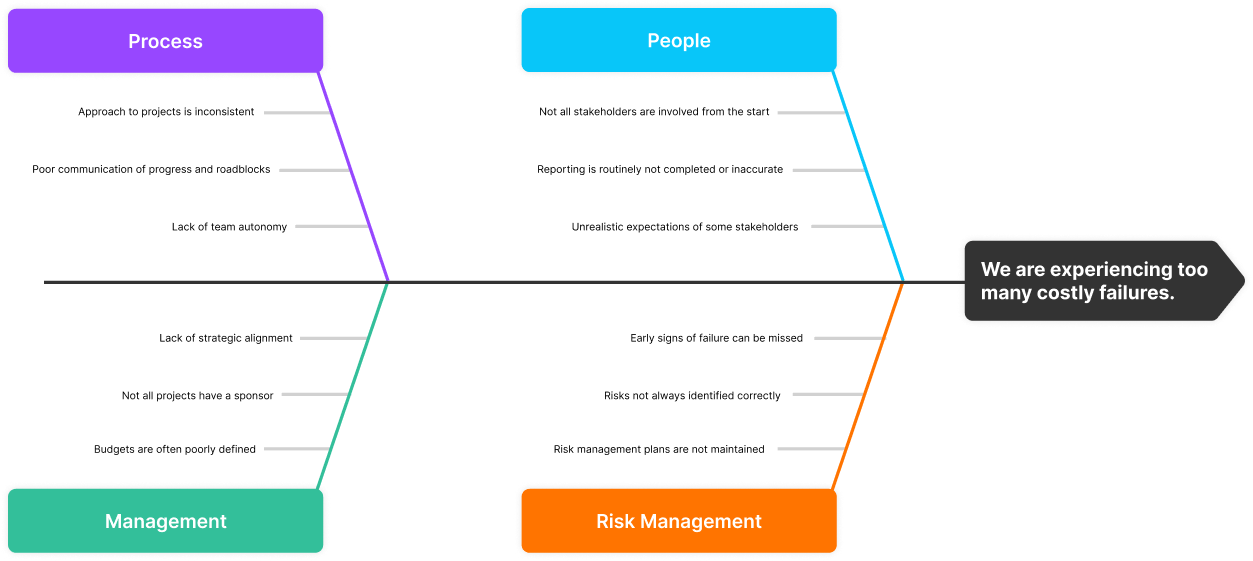
Fishbone diagram
Visually represent the factors contributing to a problem, aiding in root cause analysis for effective problem-solving.
Structured root cause analysis
Use the 6 categories to organise your root cause analysis for clarity and completeness.
Vote on the most pressing issues
Use voting to provide consensus on the issues that matter most.
Engage, save and succeed with integrated improvement tools
The all-in-one improvement toolset that will save you time and accelerate your work.
Engage, save and succeed with integrated improvement tools
The all-in-one improvement toolset that will save you time and accelerate your work.
Foster team engagement
A consistent and integrated toolset results in higher usage and broader team engagement than providing teams with standalone templates.
Save time on project admin
Upload data faster and analyse it more easily, no need to email and search for files, everything is automatically shared with the whole team.
Deliver more success
Complete projects quicker with greater success rates thanks to easy to use best practice tools and access to learn from others.

Ready to accelerate your improvement?
Start a free trial or book a demo